

CS2 Market Terminal
The CS2 skin market in one place: tracked and listed value, volume, indexes, top items, and every item's price ladder.
The CS2 market is down 0.7% over the past 7 days (+0.1% today). Graffiti fell most (−10.5%), Music Kits rose most (+0.2%). Sales volume is down 4% on the week before.
Tracked CS2 market cap
What every item we have seen in tracked inventories is worth together, and how that moved.
- Item types priced
- 25,935
- Items valued
- 5,703,888
Scanned items × skin-page price, as of 2026-11-12. How the CS2 market cap is measured
Top increases
| Item | Price | 7D | |
|---|---|---|---|
| 1 | 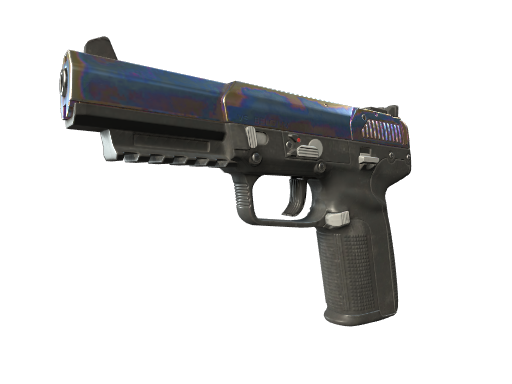 Heat Treated Five-SeveN·FN | $23.16 | +51.67%123 sold · 26/26 mkts |
| 2 | 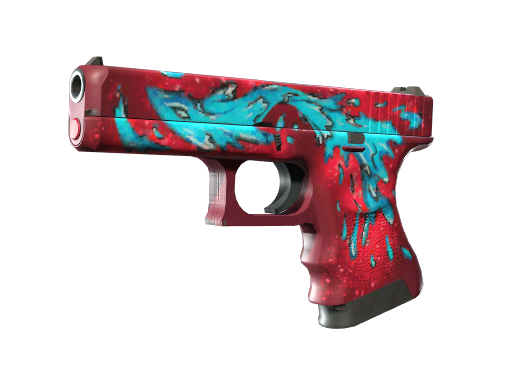 Water Elemental Glock-18·FN | $71.28 | +44.47%195 sold · 28/28 mkts |
| 3 | 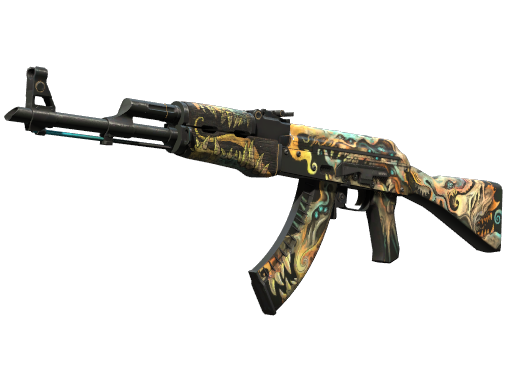 Phantom Disruptor AK-47·FN | $49.95 | +36.51%167 sold · 27/28 mkts |
| 4 | 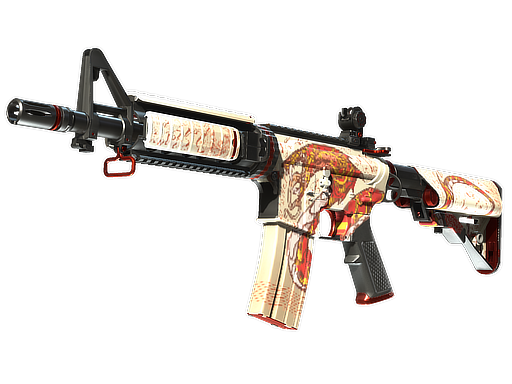 Falak M4A4·FN | $198.80 | +32.20%77 sold · 22/23 mkts |
| 5 | 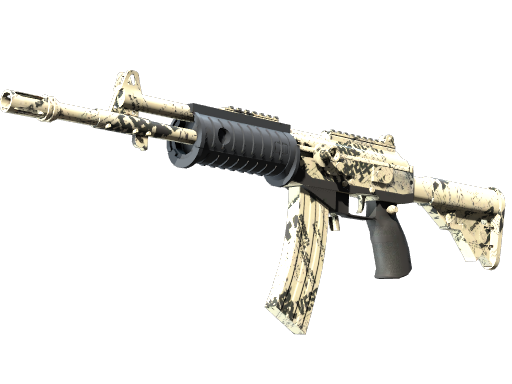 Kami Galil AR·FN | $5.74 | +31.65%29 sold · 27/29 mkts |
| 6 | 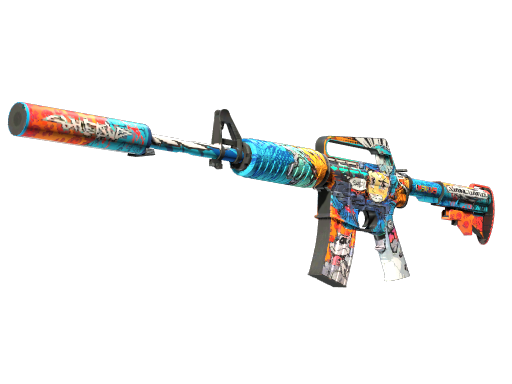 Player Two M4A1-S·FN | $199.25 | +27.11%32 sold · 27/28 mkts |
Top decreases
| Item | Price | 7D | |
|---|---|---|---|
| 1 | 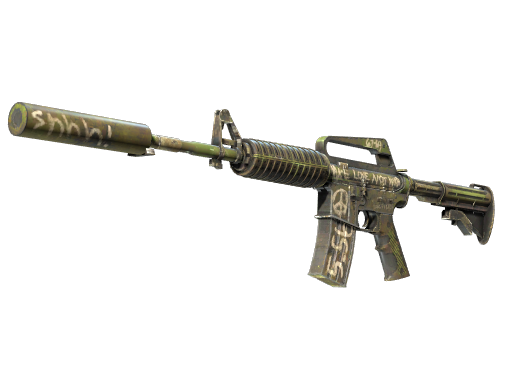 Flashback M4A1-S·FN | $88.35 | -9.41%26 sold · 29/29 mkts |
| 2 | 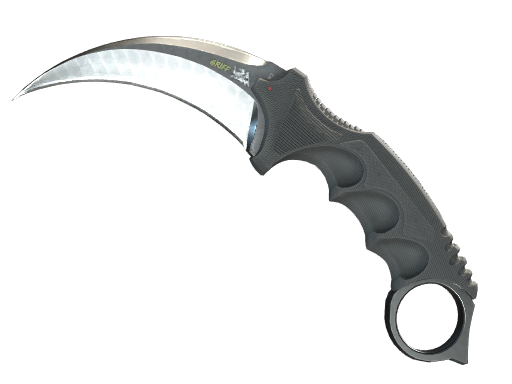 Karambit Knife | $850.54 | -9.07%48 sold · 25/25 mkts |
| 3 | 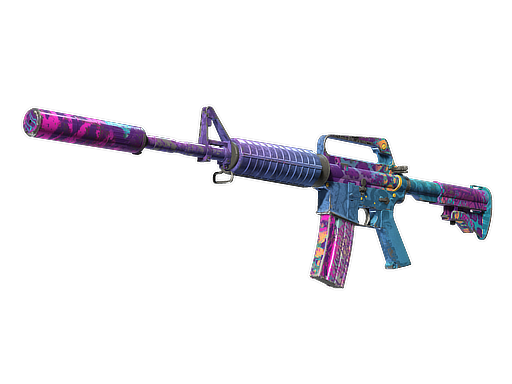 Party Animal M4A1-S·WW | $7.27 | -8.32%62 sold · 22/26 mkts |
| 4 | 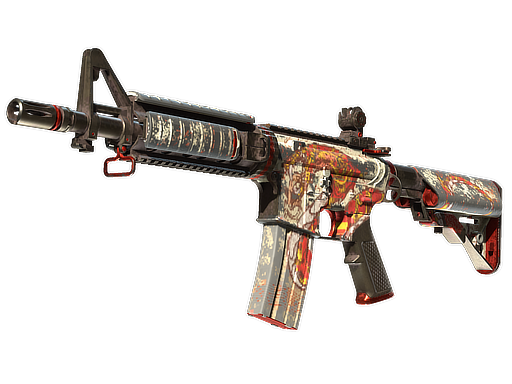 Falak M4A4·BS | $12.99 | -8.13%105 sold · 24/27 mkts |
| 5 |  Gamma Doppler Phase 2 M9 Bayonet·FN | $1,273.06 | -7.61%23 sold · 16/16 mkts |
| 6 | 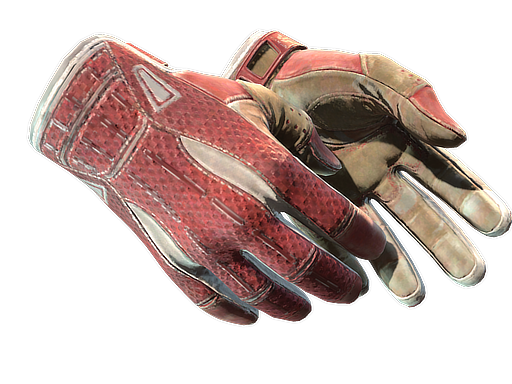 Slingshot Sport Gloves·FT | $270.85 | -6.99%137 sold · 27/30 mkts |
Most viewed
| Item | Price | Views 25H | |
|---|---|---|---|
| 1 | 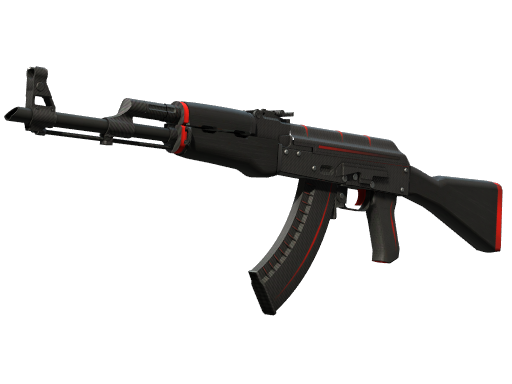 Redline AK-47·MW | $115.20 | 810 +0.12% |
| 2 | 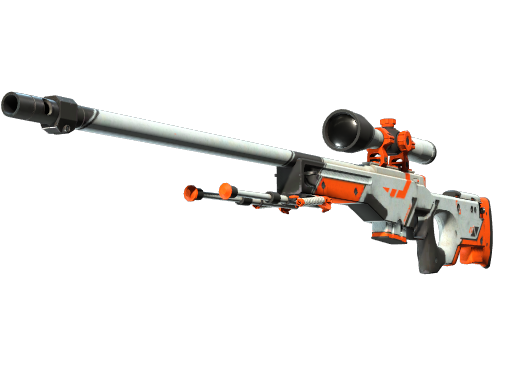 Asiimov AWP·FT | $100.78 | 612 0.00% |
| 3 | 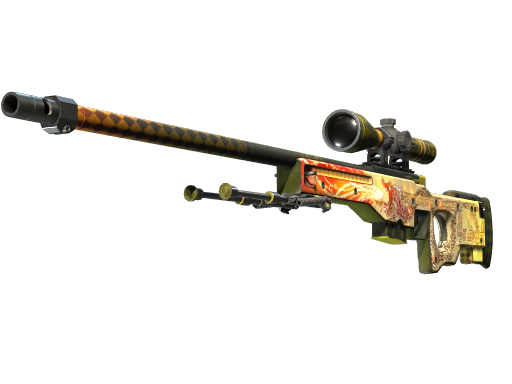 Dragon Lore AWP·FN | $10,755.09 | 552 +0.02% |
| 4 | 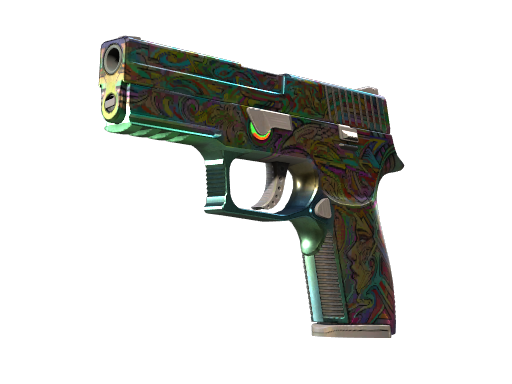 Visions P250·FN | $6.90 | 448 +0.15% |
| 5 | 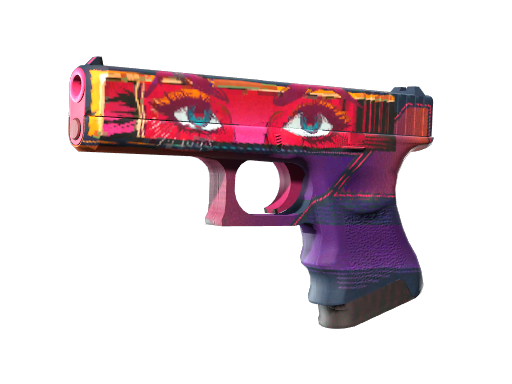 Vogue Glock-18·MW | $5.44 | 390 +0.74% |
| 6 | 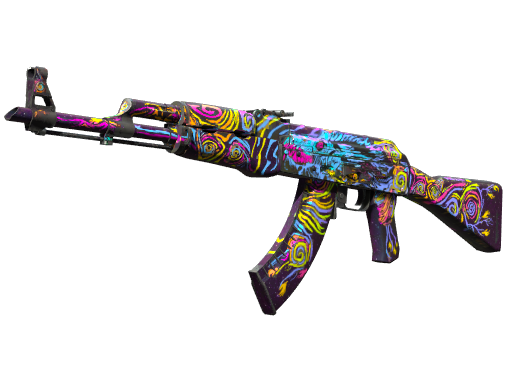 Nightwish AK-47·FT | $56.57 | 390 -0.09% |
| 7 | Nightwish AK-47·WW | $54.05 | 388 -0.30% |
| 8 | 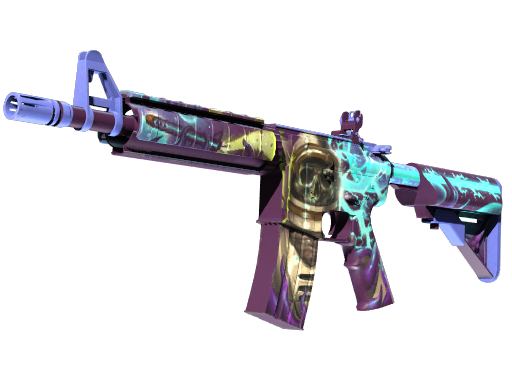 Desolate Space M4A4·WW | $11.37 | 386 +0.18% |
| 9 | 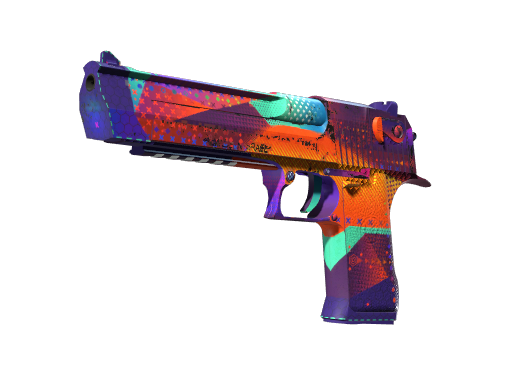 Ocean Drive Desert Eagle·WW | $58.41 | 382 +1.13% |
| 10 | 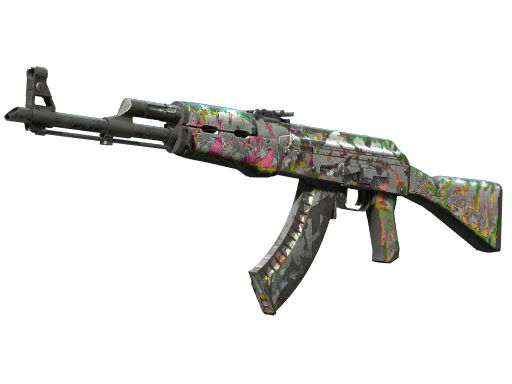 Head Shot AK-47·BS | $25.99 | 380 -0.19% |
Index base 1,000 on Dec 23, 2025 — the median price relative across items priced on both that day and the base date, a median rather than a weighted sum. Movers compare each item's Steam Analyst price with its reading seven days earlier, and list only moves with enough trading to trust.
Biggest $ movers
The skins whose price moved the most in dollars over 24 hours, up and down.
Market trends at a glance: the top five gainers and losers over a day, a week and a month.
Past 24 hours
Past 7 days
Past 30 days
Cheap versus usual
Items trading well under their own 30-day typical price right now. Only items with real trading: $10+ usual price, listed on ten or more live markets, 30+ sales a month.
| Item | Price now | Below usual |
|---|---|---|
| Tec-9 | Phoenix Chalk (WW) | $25.42 | ▼ −28% |
| P2000 | Silver (FN) | $69.11 | ▼ −24% |
| AK-47 | Leet Museo (MW) | $192.49 | ▼ −21% |
| Sticker | Falcons (Holo) | Cologne 2026 | $56.12 | ▼ −20% |
| M4A4 | Falak (BS) | $12.99 | ▼ −20% |
| Glock-18 | Gold Toof (FN) | $87.91 | ▼ −19% |
| Primeiro Tenente | Brazilian 1st Battalion | $55.69 | ▼ −17% |
| M4A1-S | Flashback (FN) | $88.31 | ▼ −17% |
| AUG | Momentum (MW) | $10.77 | ▼ −17% |
| Tec-9 | Titanium Bit (FN) | $44.99 | ▼ −16% |
Sales volume
How much money changed hands in completed CSFloat sales each day.
- 7-day average
- $863K / day
- vs the week before
- ▼ −4.36%
- Sales per day
- 6,590
CSFloat completed sales on the ~3,494 most-viewed items our nightly job refreshed last night, not the whole market. The newest day is still being reported by CSFloat, so figures stop at the last day with near-complete coverage (Nov 10).
Average skin price▲ 1-day rise
How the typical item's price moved. 1000 is where it stood on 23 Dec 2025.
What moved the market30 days
Which item types added or removed the most value in the past 30 days.
Percent is each type's share of the total change. Approximate: it ignores items added or delisted.
Where the value sits
Each category's share of tracked value, and how its prices moved over 30 days.
Share of tracked value. Right column: 30-day price change of that category's items.
Most valuable items
The items worth the most in total: price times how many we have seen in scanned inventories.
Scanned is how many we have seen in scanned inventories; tracked value = scanned x price. Changes are the market price against 1 and 7 days ago.
Market heatmap
Every group of items at a glance: bigger tile = worth more, green = up and red = down over 30 days.
Basket value, one of each item: $2.73M across 16 type indexes. Tiles too small to label show their figures on hover.
 Arabesque
 Spy Tech
 Auto Racing Sticker
 Fruits And Veggies Sticker
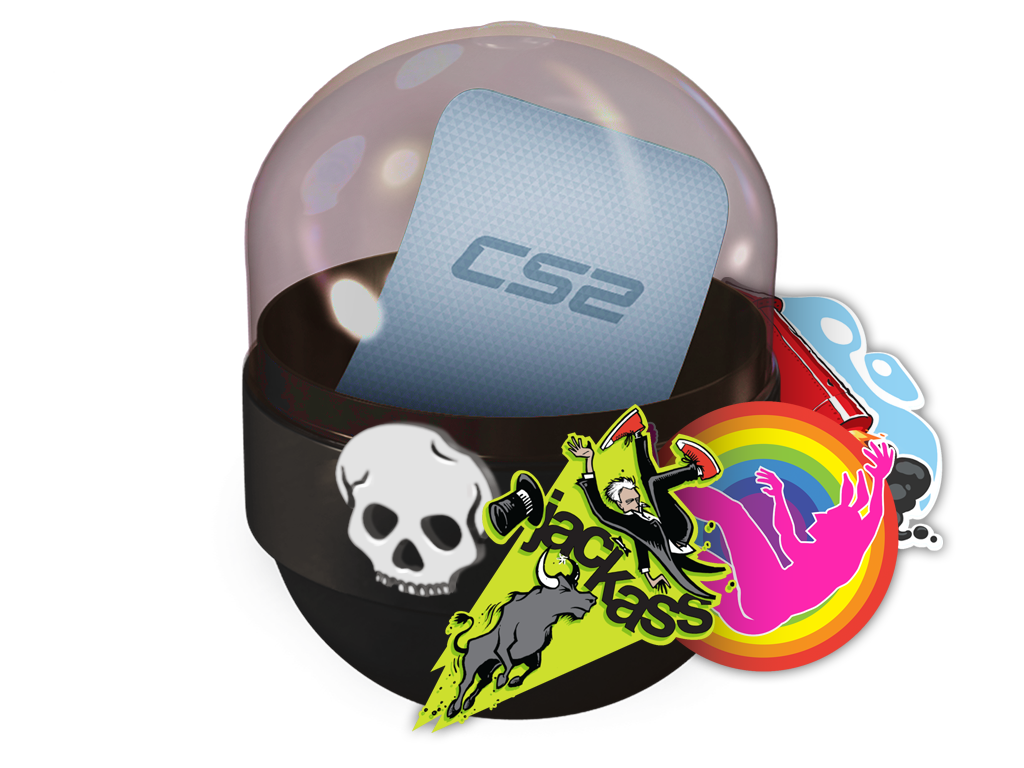 Jackass Sticker Capsule
Browse
| Image | Collection | 7D | Supply | Books | Spread | 7D trend | ||
|---|---|---|---|---|---|---|---|---|
| 1 | 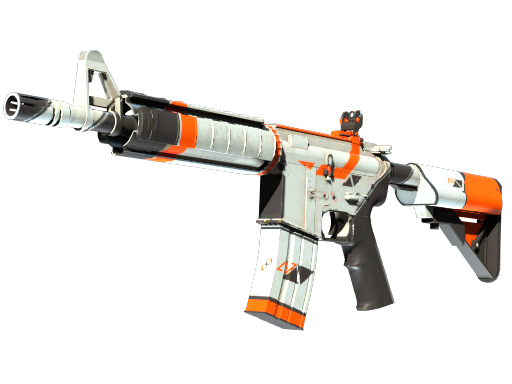 Asiimov M4A4·FT | Winter Offensive | $182.09 | +7.71% | 5,087 | 31 | 0.9% | |
| 2 | 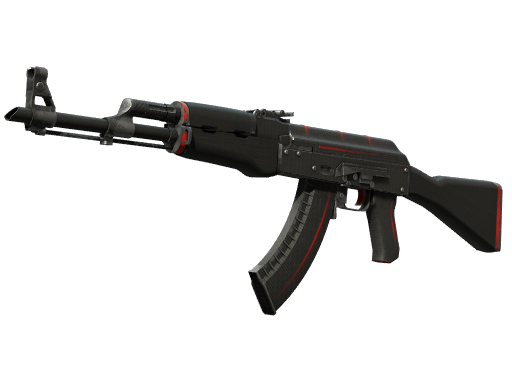 Redline AK-47·FT | Phoenix | $25.33 | -2.50% | 69,344 | 31 | 2.5% | |
| 3 | 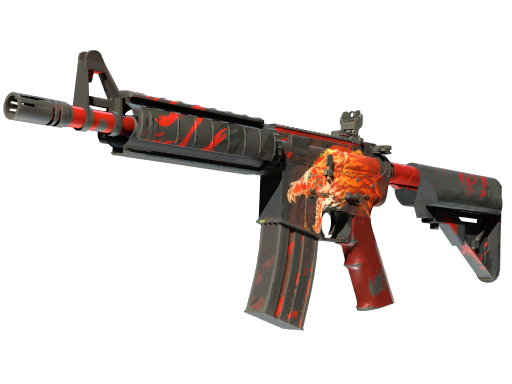 Howl M4A4·FT | Huntsman | $4,540.80 | +1.65% | 622 | 26 | 5.0% | |
| 4 | 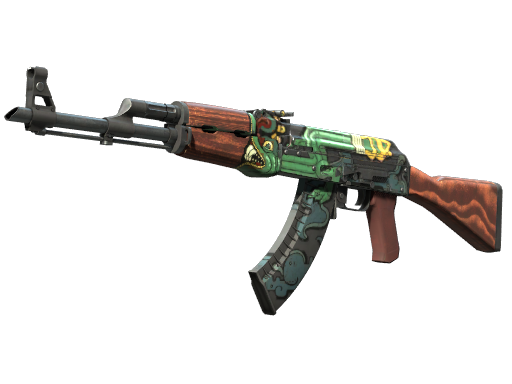 Fire Serpent AK-47·FT | Bravo | $649.40 | -1.49% | 2,669 | 30 | 4.2% | |
| 5 | Nightwish AK-47·FT | Dreams & Nightmares | $56.57 | -1.22% | 11,371 | 32 | 1.4% | |
| 6 | 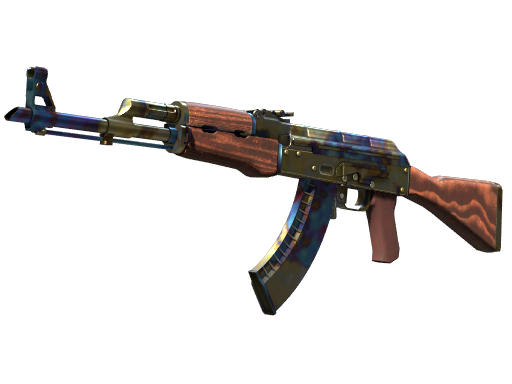 Case Hardened AK-47·FT | Arms Deal | $202.82 | +2.48% | 6,593 | 31 | 3.7% | |
| 7 | Howl M4A4·ST·FT | — | $7,502.78 | -3.98% | 147 | 22 | 9.8% | |
| 8 | 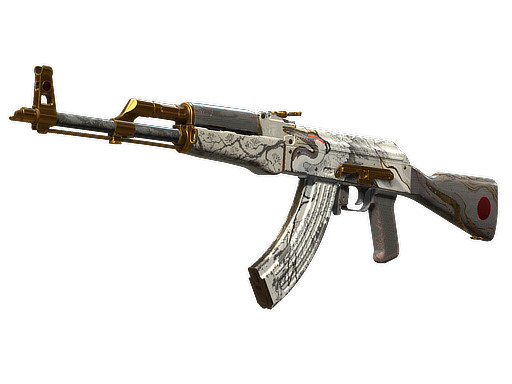 Crane Flight AK-47·FT | Dead Hand | $12.08 | -1.47% | 11,008 | 28 | 4.1% | |
| 9 | 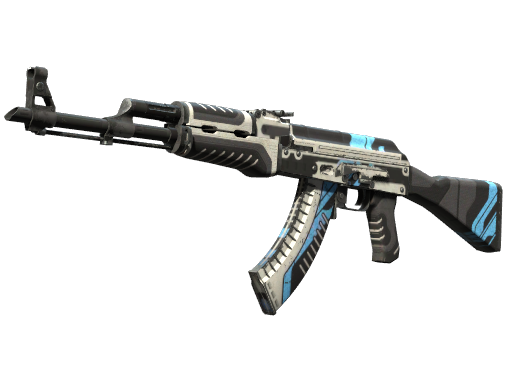 Vulcan AK-47·FT | Huntsman | $155.78 | -3.04% | 9,997 | 30 | 2.4% | |
| 10 | 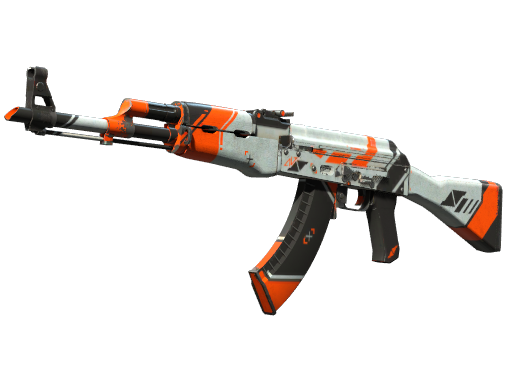 Asiimov AK-47·FT | Danger Zone | $38.65 | +0.26% | 14,505 | 32 | 0.4% | |
| 11 | 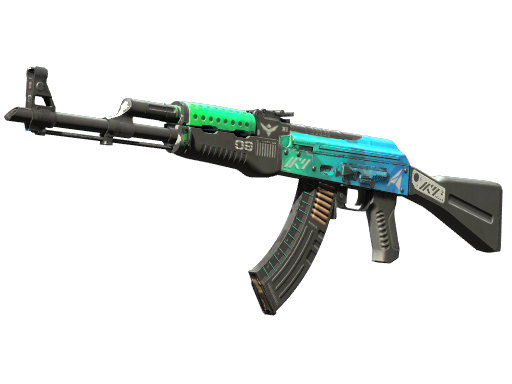 Ice Coaled AK-47·FT | Recoil | $3.96 | +1.28% | 26,597 | 30 | — | |
| 12 | 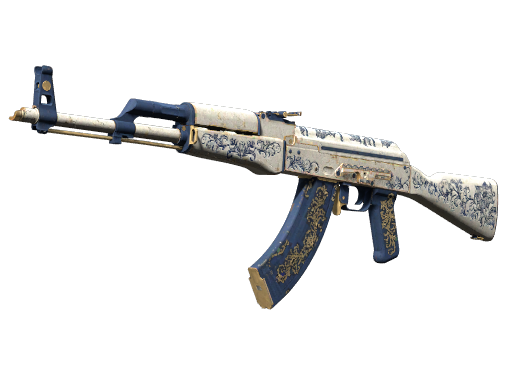 Inheritance AK-47·FT | Kilowatt | $31.08 | -1.86% | 19,678 | 30 | 2.5% | |
| 13 | 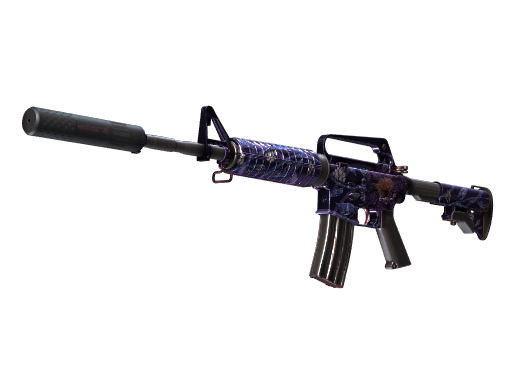 Black Lotus M4A1-S·FT | Kilowatt | $3.67 | 0.00% | 30,972 | 32 | — | |
| 14 | 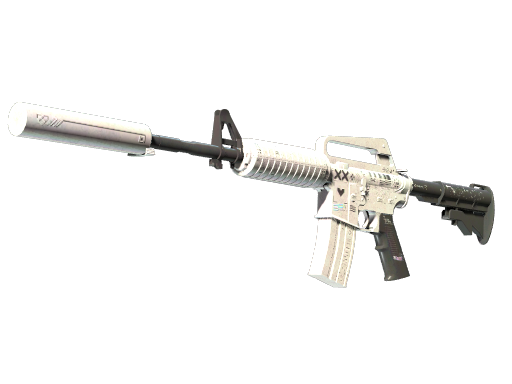 Printstream M4A1-S·FT | Operation Broken Fang | $156.79 | -0.94% | 12,818 | 31 | 1.8% | |
| 15 | 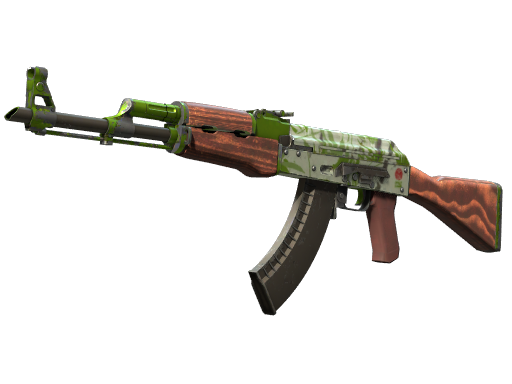 Hydroponic AK-47·FT | Rising Sun | $862.13 | +0.16% | 1,246 | 28 | 5.7% | |
| 16 | Redline AK-47·ST·FT | Phoenix | $59.44 | -2.49% | 12,547 | 29 | 4.0% | |
| 17 | 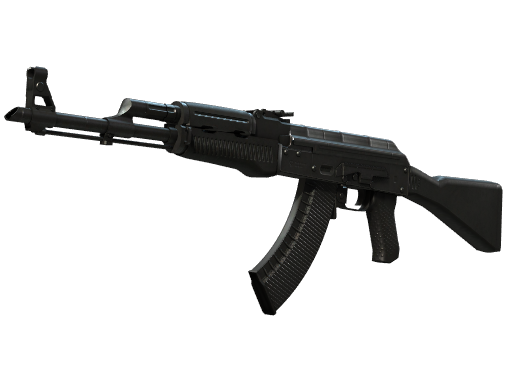 Slate AK-47·FT | Snakebite | $3.96 | +1.02% | 43,770 | 33 | — | |
| 18 | 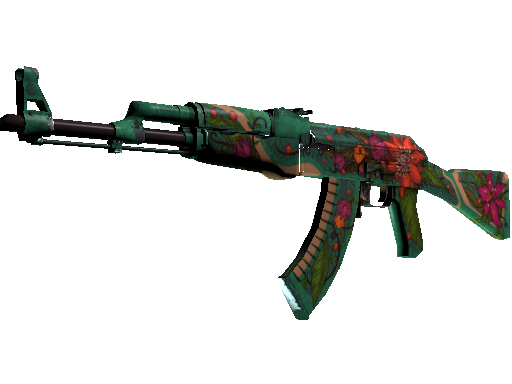 Wild Lotus AK-47·FT | St. Marc | $6,929.55 | -3.32% | 693 | 26 | 7.4% | |
| 19 | 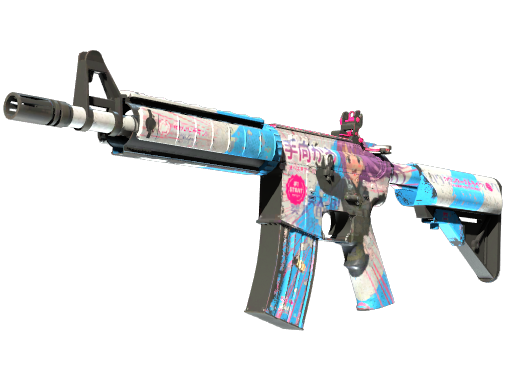 Temukau M4A4·FT | Revolution | $28.11 | -2.06% | 10,003 | 30 | 0.4% | |
| 20 | 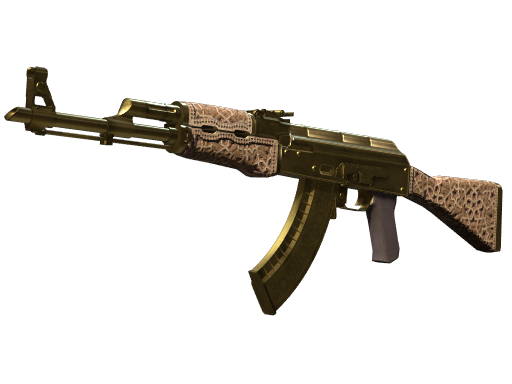 Gold Arabesque AK-47·SV·FT | 2021 Dust 2 | $1,028.41 | -5.58% | 942 | 25 | 14.0% | |
| 21 | 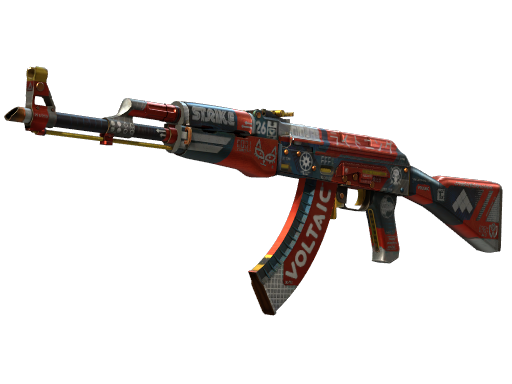 Bloodsport AK-47·FT | Spectrum | $101.64 | -2.53% | 7,024 | 29 | 1.7% | |
| 22 | Fire Serpent AK-47·ST·FT | Bravo | $1,963.33 | -2.26% | 526 | 28 | 14.4% | |
| 23 | Gold Arabesque AK-47·FT | 2021 Dust 2 | $1,111.24 | -0.23% | 1,228 | 27 | 2.9% | |
| 24 | Case Hardened AK-47·ST·FT | Arms Deal | $434.88 | -1.24% | 873 | 28 | 11.8% |
Supply is listings across every marketplace we read; books is how many hold the item today; spread is how far the best bid sits below the cheapest ask. The 7D sparkline is the daily Steam Analyst price. Click a row for its full page.
AK-47 | Redline (Field-Tested)
Price history
Item facts
| Collection | The Phoenix Collection |
| Rarity | Classified |
| Float range | 0.1 – 0.7 |
| Rating | 4.0 from 5,998 votes |
| Page views | 42,266 |
Bids & spread
 BUFFBUFF$23.18$23.789,442 ask · 116 bidYOUPIN—$23.8411,607 askC5—$24.222,631 ask
 HALOSKINS—$24.312,498 ask
 STEAM—$31.851,210 ask
Instant sell
Asks across 30 markets
 Skinport$23.02best2
 YouPin898$23.08+0.3%3
 CS.MONEY$23.18+0.7%4
 DMarket$23.23+0.9%5
 SkinSwap$23.48+2.0%6
 CSFloat$23.51+2.1%7BUFF163$23.76+3.2%8
 Aim Market$23.78+3.3%9
 BUFF Market$24.42+6.1%10
 Waxpeer$24.45+6.2%11SkinVault$24.55+6.6%12HaloSkins$24.57+6.7%13
 Moon Market$24.74+7.5%14
 Avan Market$24.86+8.0%15
 TradeIt$25.12+9.1%16
 CS.TRADE$25.19+9.4%17
 LIS-SKINS$25.29+9.9%18
 SkinRave$25.29+9.9%19
 Skin.Place$25.30+9.9%20
 Skinland$25.31+9.9%
 ShadowPay$25.54+10.9%23
 Skins.com$25.62+11.3%24
 MARKET.CSGO$26.02+13.0%25
 SkinFlow$26.21+13.9%26
 SkinBaron$26.64+15.7%27
 PirateSwap$26.76+16.2%
 SkinsMonkey$27.04+17.5%
Index data as of 2026-11-12, refreshed every 5 minutes. Admin preview, not indexed.